MikroTik Torch and Packet Sniffer
Monitoring network traffic is essential in any environment where uptime, performance, and visibility matter. MikroTik routers provide two built-in tools that help engineers and system administrators observe traffic: Torch and Packet Sniffer.
This guide explains how to use these tools, with examples and practical insights. Whether you’re troubleshooting an issue, identifying suspicious activity, or optimizing performance, understanding how to use Torch and Packet Sniffer can save time and improve outcomes.
Table of Contents
- Why Analyze MikroTik Traffic?
- Torch vs. Packet Sniffer: When to Use Each
- Torch: Real-Time Traffic Analysis Tool
- Packet Sniffer: Deep Traffic Capture Tool
- Exporting and Analyzing Captures in Wireshark
- Streaming MikroTik Sniffer to Wireshark
- Best Practices for Torch and Packet Sniffer
- Real-World Use Cases
- Troubleshooting Torch and Sniffer
- Conclusion
- Additional Resources
- FAQ
Why Analyze MikroTik Traffic?
MikroTik routers are widely used in ISPs, SMBs, and enterprise networks. Traffic analysis helps with:
- Identifying bandwidth abuse
- Spotting misconfigured devices
- Detecting malware or scanning activity
- Verifying QoS and firewall effectiveness
- Diagnosing slow connections or performance problems
Torch vs. Packet Sniffer: When to Use Each
| Feature | Torch | Packet Sniffer |
|---|---|---|
| Type | Real-time, lightweight | Deep packet inspection |
| Use case | See top talkers, protocols | Export traffic for detailed review |
| Interface | CLI / Winbox | CLI / Winbox |
| Output | IPs, ports, protocols, speed | .pcap file for Wireshark |
| Performance | Low impact | Medium to high impact |
Torch: Real-Time Traffic Analysis Tool
What is MikroTik Torch?
Torch is a built-in traffic monitoring tool that displays real-time flow data through a selected interface. It shows:
- Source and destination IP addresses
- Source and destination ports
- Protocols (TCP, UDP, ICMP, etc.)
- TX and RX speeds in bits per second
How to Use Torch via Winbox
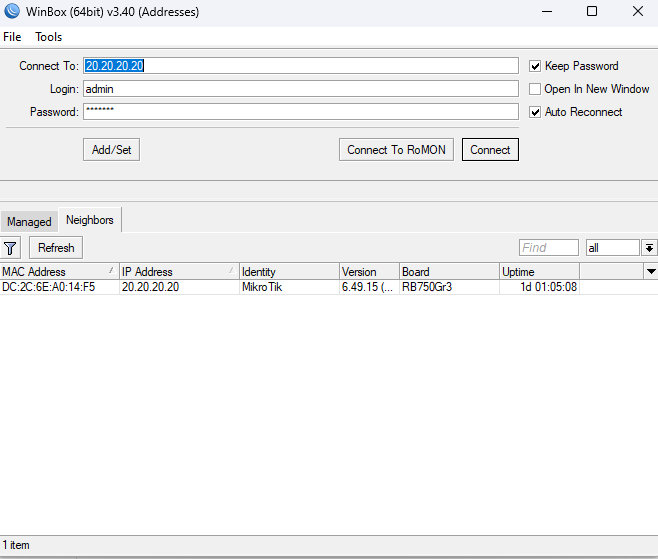
- Open Winbox and log in.
- Go to Tools > Torch.
- Select the interface (e.g., ether1).
- Click Start.
You will see live traffic data sorted by IPs, ports, and speed.
How to Use Torch via CLI
/tool torch interface=ether1Filter by protocol:
/tool torch interface=ether1 protocol=tcpFilter by port:
/tool torch interface=ether1 port=80Filtering Options in Torch
| Filter | Example |
|---|---|
| Interface | interface=ether1 |
| Protocol | protocol=udp |
| Src/Dst IP | src-address=192.168.1.100 |
| Port | port=443 |
/tool torch interface=ether1 src-address=10.0.0.1 port=80Example: Diagnosing a Slow Connection
/tool torch interface=ether1Look for IPs with high TX or RX values. Limit their usage or apply queues to manage bandwidth.
Packet Sniffer: Deep Traffic Capture Tool
What is MikroTik Packet Sniffer?
Packet Sniffer captures packets on specified interfaces and saves them to a .pcap file. You can open these files in tools like Wireshark.
How to Start Packet Sniffer in Winbox
- Go to Tools > Packet Sniffer.
- Select the interface.
- Set filter options (IP, port, MAC).
- Enter a file name.
- Click Start and then Stop when done.
How to Start Packet Sniffer in CLI
/tool sniffer set interface=ether1 file-name=sniff1.pcap filter-ip-address=192.168.88.1
/tool sniffer start
/tool sniffer stop
Common Sniffer Configuration Options
| Option | Example |
|---|---|
| Interface | interface=bridge-local |
| IP Filter | filter-ip-address=192.168.1.10 |
| Port Filter | filter-port=443 |
| File Name | file-name=https_capture.pcap |
| Stream to Host | streaming-enabled=yes |
| Streaming Server | streaming-server=192.168.1.100 |
Example: Capturing DNS Traffic
/tool sniffer set interface=ether1 filter-port=53 file-name=dns_capture.pcap
/tool sniffer start
/tool sniffer stop
Exporting and Analyzing Captures in Wireshark
- Download the
.pcapfile from the router. - Open it in Wireshark.
- Apply filters like
ip.addr == 192.168.1.10ordns. - Inspect TCP streams and packet flags.
Streaming MikroTik Sniffer to Wireshark
- Start Wireshark and capture on your network interface.
- Run the following on MikroTik:
/tool sniffer set streaming-enabled=yes streaming-server=192.168.88.100 interface=ether1
/tool sniffer start
Best Practices for Torch and Packet Sniffer
- Use interface-specific captures
- Apply filters to reduce noise
- Monitor CPU usage on large networks
- Use off-peak times for deep captures
- Restrict access to monitoring tools
Real-World Use Cases
- Malware detection: Use Sniffer to inspect unusual ports or domains
- Bandwidth abuse: Identify top talkers with Torch
- NAT debugging: Capture WAN/LAN traffic to compare translation
- SIP call drops: Analyze RTP/5060 traffic using Sniffer and Wireshark
Troubleshooting Torch and Sniffer
- Torch shows no data: Check interface and filters
- No .pcap file: Verify file name and storage space
- Wireshark error: Confirm valid format and complete capture
Conclusion
Torch and Packet Sniffer give MikroTik users direct access to detailed traffic analysis. Use Torch for fast, real-time visibility. Use Packet Sniffer for deep inspection and forensics. Combine both to solve performance and security problems more efficiently.
Additional Resources
- MikroTik Torch Documentation
- MikroTik Packet Sniffer Docs
- Wireshark Download
- MikroTik Forum
- Reddit r/mikrotik
FAQ
What is MikroTik Torch used for?
Torch is used for real-time analysis of IP traffic on a selected interface. It shows IPs, ports, protocols, and speeds.
How do I export MikroTik traffic to Wireshark?
Use the Packet Sniffer to create a .pcap file or stream live traffic to Wireshark by enabling streaming mode.
Is MikroTik Packet Sniffer safe to use in production?
It is safe for small captures, but avoid running long sessions during high traffic hours, as it may impact performance.
Can Torch analyze encrypted traffic?
Torch shows protocol and bandwidth data but cannot decode encrypted traffic like HTTPS.
Where are packet capture files saved?
Files are stored in the Files section in Winbox. You can also access them via FTP or WebFig.
Check our list of MikroTik guides.