Monitoring Mikrotik with Grafana and Prometheus: A Complete Setup Guide
Network monitoring prevents costly downtime and performance issues. MikroTik devices power enterprise networks worldwide, but standard monitoring tools often lack the depth needed for proactive management.
Why Monitor Your MikroTik Infrastructure?
- Performance optimization: Identify bandwidth bottlenecks before they impact users
- Proactive issue detection: Spot hardware failures and configuration problems early
- Compliance monitoring: Track SLA metrics and generate automated reports
- Capacity planning: Make data-driven decisions about network upgrades
The Grafana + Prometheus Advantage for MikroTik
- Open-source solution: No licensing costs for monitoring infrastructure
- Real-time metrics: Sub-second data collection and visualization
- Enterprise scalability: Monitor hundreds of devices from a single platform
- Flexible alerting: Custom notifications via email, Slack, or webhook
What This Guide Covers
- Complete step-by-step setup for Ubuntu Server 22.04
- SNMP and API monitoring configuration
- Dashboard templates for common use cases
- Production security and performance optimization
- Troubleshooting guide for common problems
Table of Contents
- Prerequisites and Architecture Overview
- Preparing Your MikroTik Devices
- Installing Prometheus
- SNMP Exporter Setup
- Grafana Installation
- Creating MikroTik Dashboards
- Setting Up Alerting
- Advanced Monitoring Scenarios
- Troubleshooting Common Issues
- Production Deployment Best Practices
- Conclusion
Prerequisites and Architecture Overview
MikroTik Monitoring Architecture
The monitoring stack consists of four main components working together:
- MikroTik devices: RouterOS 6.x or 7.x with SNMP enabled
- Prometheus server: Collects and stores time-series metrics
- SNMP Exporter: Translates SNMP data to Prometheus format
- Grafana: Creates dashboards and manages alerts
System Requirements
- Operating system: Ubuntu Server 20.04 LTS or newer (22.04 recommended)
- Memory: 4GB RAM minimum, 8GB for production environments
- Storage: 50GB+ depending on retention period and device count
- Network: Direct connectivity to all monitored MikroTik devices
- CPU: 2+ cores recommended for multiple device monitoring
MikroTik RouterOS Compatibility
- RouterOS 6.x: Full SNMP v2c support, limited API functionality
- RouterOS 7.x: Enhanced SNMP features and improved API performance
- Performance considerations: Lower-end devices may need adjusted scrape intervals
Preparing Your MikroTik Devices for Monitoring
Enable SNMP on MikroTik RouterOS
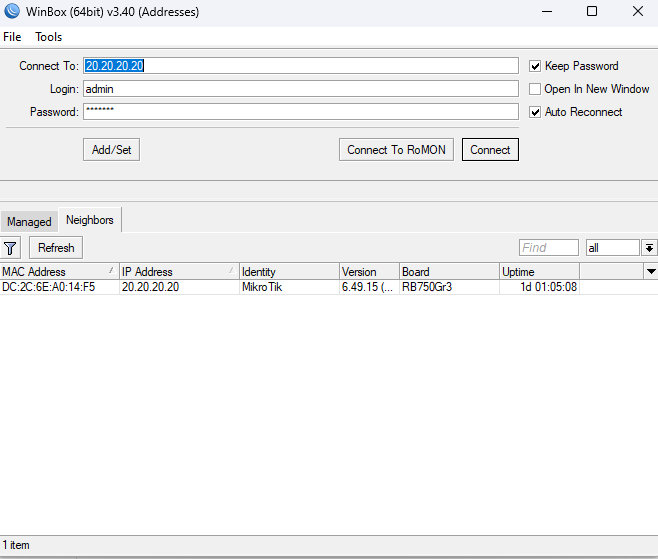
Connect to your MikroTik device via SSH or Winbox and run these commands:
# Enable SNMP service
/snmp set enabled=yes

# Create read-only community
/snmp community add name=monitoring-ro addresses=10.0.0.0/8

# Verify SNMP configuration
/snmp print
/snmp community print
SNMP Security Best Practices
- Use specific IP ranges: Restrict community access to monitoring server subnets
- Avoid default communities: Never use “public” or “private” in production
- Generate complex strings: Use 16+ character random community names
- Regular rotation: Change community strings quarterly for security
Configure SNMPv3 for Enhanced Security
# Create SNMPv3 user with authentication
/snmp set enabled=yes
/snmp community add name="" security=private

# Add SNMPv3 user
/user add name=snmp-monitor group=read password=SecurePassword123

# Configure authentication and privacy
/snmp set auth-key=AuthKey123456 priv-key=PrivKey654321
Firewall Configuration for SNMP
Create firewall rules to allow SNMP access from your monitoring server:
# Allow SNMP from monitoring server
/ip firewall filter add chain=input protocol=udp dst-port=161 \
src-address=10.1.1.100 action=accept comment="SNMP Monitoring"

# Block all other SNMP traffic
/ip firewall filter add chain=input protocol=udp dst-port=161 \
action=drop comment="Block SNMP"
Key MikroTik SNMP OIDs for Monitoring
- System uptime: 1.3.6.1.2.1.1.3.0
- CPU usage: 1.3.6.1.4.1.14988.1.1.3.11.0
- Memory usage: 1.3.6.1.2.1.25.2.3.1.6
- Interface statistics: 1.3.6.1.2.1.2.2.1
- Temperature: 1.3.6.1.4.1.14988.1.1.3.10.0
- Voltage: 1.3.6.1.4.1.14988.1.1.3.8.0
Test SNMP Connectivity
From your monitoring server, verify SNMP access:
# Install SNMP tools
sudo apt update
sudo apt install snmp snmp-mibs-downloader

# Test SNMP connectivity
snmpwalk -v2c -c monitoring-ro 192.168.1.1 1.3.6.1.2.1.1.1.0

# Test MikroTik-specific OIDs
snmpget -v2c -c monitoring-ro 192.168.1.1 1.3.6.1.4.1.14988.1.1.3.11.0
Installing and Configuring Prometheus
Create Prometheus User and Directories
# Update system packages
sudo apt update && sudo apt upgrade -y

# Create prometheus system user
sudo groupadd --system prometheus
sudo useradd -s /sbin/nologin --system -g prometheus prometheus

# Create directory structure
sudo mkdir /var/lib/prometheus
sudo mkdir -p /etc/prometheus/{rules,rules.d,files_sd}

# Set permissions
sudo chown prometheus:prometheus /var/lib/prometheus
sudo chown -R prometheus:prometheus /etc/prometheus
Download and Install Prometheus
# Download latest Prometheus release
cd /tmp
wget https://github.com/prometheus/prometheus/releases/download/v2.45.0/prometheus-2.45.0.linux-amd64.tar.gz

# Extract and install
tar -xvf prometheus-2.45.0.linux-amd64.tar.gz
cd prometheus-2.45.0.linux-amd64

# Copy binaries
sudo cp prometheus /usr/local/bin/
sudo cp promtool /usr/local/bin/

# Set permissions
sudo chown prometheus:prometheus /usr/local/bin/prometheus
sudo chown prometheus:prometheus /usr/local/bin/promtool

# Copy configuration files
sudo cp -r consoles /etc/prometheus
sudo cp -r console_libraries /etc/prometheus
sudo chown -R prometheus:prometheus /etc/prometheus/consoles
sudo chown -R prometheus:prometheus /etc/prometheus/console_libraries
Create Prometheus Configuration File
sudo nano /etc/prometheus/prometheus.ymlAdd this configuration:
global:
  scrape_interval: 30s
  evaluation_interval: 30s
  external_labels:
    monitor: 'mikrotik-monitor'

rule_files:
  - "rules/*.yml"

alerting:
  alertmanagers:
    - static_configs:
        - targets:
          - localhost:9093

scrape_configs:
  - job_name: 'prometheus'
    static_configs:
      - targets: ['localhost:9090']

  - job_name: 'mikrotik-snmp'
    static_configs:
      - targets:
        - 192.168.1.1  # MikroTik device IP
        - 192.168.1.2  # Add more devices as needed
    metrics_path: /snmp
    params:
      module: [mikrotik]
    relabel_configs:
      - source_labels: [__address__]
        target_label: __param_target
      - source_labels: [__param_target]
        target_label: instance
      - target_label: __address__
        replacement: localhost:9116  # SNMP exporter address
Create Prometheus System Service
sudo nano /etc/systemd/system/prometheus.serviceAdd this service configuration:
[Unit]
Description=Prometheus Monitoring System
Documentation=https://prometheus.io/docs/
After=network-online.target
Wants=network-online.target

[Service]
User=prometheus
Group=prometheus
Type=simple
Restart=on-failure
RestartSec=5s
ExecStart=/usr/local/bin/prometheus \
  --config.file=/etc/prometheus/prometheus.yml \
  --storage.tsdb.path=/var/lib/prometheus/ \
  --storage.tsdb.retention.time=30d \
  --web.console.templates=/etc/prometheus/consoles \
  --web.console.libraries=/etc/prometheus/console_libraries \
  --web.listen-address=0.0.0.0:9090 \
  --web.enable-lifecycle \
  --log.level=info

[Install]
WantedBy=multi-user.target
Start and Enable Prometheus
# Reload systemd
sudo systemctl daemon-reload

# Start Prometheus
sudo systemctl start prometheus

# Enable auto-start
sudo systemctl enable prometheus

# Check status
sudo systemctl status prometheus

# Test web interface
curl http://localhost:9090/metrics
SNMP Exporter Setup and Configuration
Download and Install SNMP Exporter
# Download SNMP exporter
cd /tmp
wget https://github.com/prometheus/snmp_exporter/releases/download/v0.24.1/snmp_exporter-0.24.1.linux-amd64.tar.gz

# Extract files
tar -xvf snmp_exporter-0.24.1.linux-amd64.tar.gz
cd snmp_exporter-0.24.1.linux-amd64

# Install binary
sudo cp snmp_exporter /usr/local/bin/
sudo chown prometheus:prometheus /usr/local/bin/snmp_exporter

# Create configuration directory
sudo mkdir /etc/snmp_exporter
sudo chown prometheus:prometheus /etc/snmp_exporter
Download MikroTik SNMP Configuration
# Download pre-built configuration for MikroTik
sudo wget -O /etc/snmp_exporter/snmp.yml \
https://raw.githubusercontent.com/prometheus/snmp_exporter/main/snmp.yml

# Set permissions
sudo chown prometheus:prometheus /etc/snmp_exporter/snmp.yml
Create Custom MikroTik SNMP Configuration
For advanced monitoring, create a custom configuration:
sudo nano /etc/snmp_exporter/snmp.ymlAdd MikroTik-specific configuration:
mikrotik:
  walk:
    - 1.3.6.1.2.1.1           # System information
    - 1.3.6.1.2.1.2.2.1       # Interface statistics
    - 1.3.6.1.4.1.14988.1.1.3 # MikroTik system stats
    - 1.3.6.1.2.1.25.2.3.1    # Memory usage
  metrics:
    - name: sysUpTime
      oid: 1.3.6.1.2.1.1.3
      type: gauge
      help: System uptime in hundredths of a second
    - name: mikrotikCpuUsage
      oid: 1.3.6.1.4.1.14988.1.1.3.11
      type: gauge
      help: CPU usage percentage
    - name: mikrotikTemperature
      oid: 1.3.6.1.4.1.14988.1.1.3.10
      type: gauge
      help: System temperature in Celsius
    - name: mikrotikVoltage
      oid: 1.3.6.1.4.1.14988.1.1.3.8
      type: gauge
      help: System voltage
  version: 2
  auth:
    community: monitoring-ro
Create SNMP Exporter Service
sudo nano /etc/systemd/system/snmp_exporter.serviceAdd service configuration:
[Unit]
Description=SNMP Exporter
Documentation=https://github.com/prometheus/snmp_exporter
After=network.target

[Service]
User=prometheus
Group=prometheus
Type=simple
Restart=on-failure
RestartSec=5s
ExecStart=/usr/local/bin/snmp_exporter \
  --config.file=/etc/snmp_exporter/snmp.yml \
  --web.listen-address=0.0.0.0:9116 \
  --log.level=info

[Install]
WantedBy=multi-user.target
Start SNMP Exporter Service
# Start and enable service
sudo systemctl daemon-reload
sudo systemctl start snmp_exporter
sudo systemctl enable snmp_exporter

# Verify operation
sudo systemctl status snmp_exporter

# Test SNMP exporter
curl "http://localhost:9116/snmp?target=192.168.1.1&module=mikrotik"
Grafana Installation and Configuration
Install Grafana from Official Repository
# Install prerequisites
sudo apt install -y software-properties-common

# Add Grafana GPG key
wget -q -O - https://packages.grafana.com/gpg.key | sudo apt-key add -

# Add Grafana repository
echo "deb https://packages.grafana.com/oss/deb stable main" | \
sudo tee /etc/apt/sources.list.d/grafana.list

# Update package list
sudo apt update

# Install Grafana
sudo apt install grafana

# Start and enable Grafana
sudo systemctl start grafana-server
sudo systemctl enable grafana-server
Configure Grafana Security Settings
# Edit Grafana configuration
sudo nano /etc/grafana/grafana.ini
Update these settings for security:
[server]
http_port = 3000
domain = your-domain.com
root_url = https://your-domain.com/grafana

[security]
admin_user = admin
admin_password = YourSecurePassword123
secret_key = YourSecretKey456789
disable_gravatar = true

[auth.anonymous]
enabled = false

[users]
allow_sign_up = false
allow_org_create = false

[auth]
disable_login_form = false
disable_signout_menu = false
Configure Grafana Data Sources
- Open browser and navigate to http://your-server:3000
- Login with admin credentials you configured
- Go to Configuration > Data Sources
- Click “Add data source”
- Select “Prometheus”
- Configure settings:
- URL: http://localhost:9090
- Access: Server (default)
- Scrape interval: 30s
- Query timeout: 60s
Test Prometheus Connection
Click “Save & Test” to verify the connection. You should see “Data source is working” message.
Creating Comprehensive MikroTik Dashboards
Network Overview Dashboard
Create a high-level dashboard showing network health:
Key Panels to Include:
- Device Status Panel: Shows online/offline status for all devices
- Total Bandwidth Usage: Aggregate traffic across all interfaces
- Critical Alerts Summary: Current alerts requiring attention
- System Uptime: Device availability over time
Sample Queries:
# Device uptime
up{job="mikrotik-snmp"}

# Interface bandwidth utilization
rate(ifHCInOctets[5m]) * 8

# CPU usage across devices
avg by (instance) (mikrotikCpuUsage)
Interface Performance Dashboard
Focus on network interface metrics and performance:
Essential Interface Metrics:
- Bandwidth utilization graphs: In/out traffic with historical trends
- Packet rate monitoring: PPS (packets per second) statistics
- Error rate analysis: Input/output errors and discards
- Interface status: Up/down status with change notifications
Interface Performance Queries:
# Interface input bytes rate
rate(ifHCInOctets[5m]) * 8

# Interface output bytes rate
rate(ifHCOutOctets[5m]) * 8

# Interface utilization percentage
(rate(ifHCInOctets[5m]) * 8) / ifHighSpeed * 100

# Interface error rate
rate(ifInErrors[5m]) + rate(ifOutErrors[5m])
System Resources Dashboard
Monitor hardware and system performance metrics:
System Health Panels:
- CPU utilization trends: Historical CPU usage with peak identification
- Memory usage monitoring: RAM utilization and available memory
- Temperature monitoring: Hardware temperature with critical thresholds
- Storage utilization: Disk space usage and growth trends
System Resource Queries:
# CPU usage percentage
mikrotikCpuUsage

# Memory utilization
(hrStorageUsed / hrStorageSize) * 100

# System temperature
mikrotikTemperature

# System voltage
mikrotikVoltage

# Free memory
hrMemorySize - hrMemoryUsed
Wireless Performance Dashboard
For wireless-enabled MikroTik devices:
Wireless-Specific Metrics:
- Client connection statistics: Connected clients and session duration
- Signal strength monitoring: RSSI values and signal quality
- Channel utilization: RF spectrum usage and interference
- Throughput analysis: Wireless bandwidth utilization per client
Dashboard Configuration Best Practices
- Use consistent time ranges: Set default time range to 1 hour with 6-hour and 24-hour options
- Implement proper thresholds: Red for critical, yellow for warning, green for normal
- Group related metrics: Organize panels logically by function or device type
- Add contextual information: Include device names, locations, and purposes
- Enable auto-refresh: Set 30-second refresh intervals for real-time monitoring
Variable Configuration for Dynamic Dashboards
Create template variables for flexible dashboard views:
- Device selection: Allow filtering by specific MikroTik devices
- Interface filtering: Show specific interfaces or interface types
- Time range variables: Quick selection of common time periods
- Location grouping: Filter devices by physical location
Setting Up Alerting and Notifications
Create Prometheus Alerting Rules
sudo nano /etc/prometheus/rules/mikrotik.ymlAdd essential alerting rules:
groups:
- name: mikrotik.rules
  rules:
  - alert: MikroTikDeviceDown
    expr: up{job="mikrotik-snmp"} == 0
    for: 2m
    labels:
      severity: critical
    annotations:
      summary: "MikroTik device {{ $labels.instance }} is down"
      description: "Device has been unreachable for more than 2 minutes"

  - alert: HighCPUUsage
    expr: mikrotikCpuUsage > 80
    for: 5m
    labels:
      severity: warning
    annotations:
      summary: "High CPU usage on {{ $labels.instance }}"
      description: "CPU usage is {{ $value }}% for more than 5 minutes"

  - alert: HighMemoryUsage
    expr: (hrStorageUsed / hrStorageSize * 100) > 85
    for: 5m
    labels:
      severity: warning
    annotations:
      summary: "High memory usage on {{ $labels.instance }}"
      description: "Memory usage is {{ $value }}% for more than 5 minutes"

  - alert: InterfaceDown
    expr: ifOperStatus == 2
    for: 1m
    labels:
      severity: warning
    annotations:
      summary: "Interface down on {{ $labels.instance }}"
      description: "Interface {{ $labels.ifDescr }} has been down for more than 1 minute"

  - alert: HighTemperature
    expr: mikrotikTemperature > 70
    for: 3m
    labels:
      severity: critical
    annotations:
      summary: "High temperature on {{ $labels.instance }}"
      description: "Device temperature is {{ $value }}°C for more than 3 minutes"

  - alert: BandwidthUtilizationHigh
    expr: (rate(ifHCInOctets[5m]) * 8 / ifHighSpeed * 100) > 90
    for: 5m
    labels:
      severity: warning
    annotations:
      summary: "High bandwidth utilization on {{ $labels.instance }}"
      description: "Interface {{ $labels.ifDescr }} utilization is {{ $value }}%"
Install and Configure AlertManager
# Download AlertManager
cd /tmp
wget https://github.com/prometheus/alertmanager/releases/download/v0.26.0/alertmanager-0.26.0.linux-amd64.tar.gz

# Extract and install
tar -xvf alertmanager-0.26.0.linux-amd64.tar.gz
cd alertmanager-0.26.0.linux-amd64

# Copy binary
sudo cp alertmanager /usr/local/bin/
sudo cp amtool /usr/local/bin/

# Set permissions
sudo chown prometheus:prometheus /usr/local/bin/alertmanager
sudo chown prometheus:prometheus /usr/local/bin/amtool

# Create configuration directory
sudo mkdir /etc/alertmanager
sudo chown prometheus:prometheus /etc/alertmanager
Configure AlertManager
sudo nano /etc/alertmanager/alertmanager.ymlAdd notification configuration:
global:
  smtp_smarthost: 'smtp.gmail.com:587'
  smtp_from: 'monitoring@yourcompany.com'
  smtp_auth_username: 'monitoring@yourcompany.com'
  smtp_auth_password: 'your-app-password'

route:
  group_by: ['alertname']
  group_wait: 10s
  group_interval: 10s
  repeat_interval: 1h
  receiver: 'web.hook'
  routes:
  - match:
      severity: critical
    receiver: 'critical-alerts'
  - match:
      severity: warning
    receiver: 'warning-alerts'

receivers:
- name: 'web.hook'
  webhook_configs:
  - url: 'http://127.0.0.1:5001/'

- name: 'critical-alerts'
  email_configs:
  - to: 'admin@yourcompany.com'
    subject: 'CRITICAL: MikroTik Alert - {{ .GroupLabels.alertname }}'
    body: |
      {{ range .Alerts }}
      Alert: {{ .Annotations.summary }}
      Description: {{ .Annotations.description }}
      Instance: {{ .Labels.instance }}
      Severity: {{ .Labels.severity }}
      {{ end }}

- name: 'warning-alerts'
  email_configs:
  - to: 'network-team@yourcompany.com'
    subject: 'WARNING: MikroTik Alert - {{ .GroupLabels.alertname }}'
    body: |
      {{ range .Alerts }}
      Alert: {{ .Annotations.summary }}
      Description: {{ .Annotations.description }}
      Instance: {{ .Labels.instance }}
      {{ end }}

inhibit_rules:
  - source_match:
      severity: 'critical'
    target_match:
      severity: 'warning'
    equal: ['alertname', 'dev', 'instance']
Create AlertManager Service
sudo nano /etc/systemd/system/alertmanager.serviceAdd service configuration:
[Unit]
Description=Alertmanager
Wants=network-online.target
After=network-online.target

[Service]
User=prometheus
Group=prometheus
Type=simple
Restart=on-failure
RestartSec=5s
ExecStart=/usr/local/bin/alertmanager \
  --config.file=/etc/alertmanager/alertmanager.yml \
  --storage.path=/var/lib/alertmanager/ \
  --web.external-url=http://localhost:9093

[Install]
WantedBy=multi-user.target
Start AlertManager
# Create data directory
sudo mkdir /var/lib/alertmanager
sudo chown prometheus:prometheus /var/lib/alertmanager

# Start and enable service
sudo systemctl daemon-reload
sudo systemctl start alertmanager
sudo systemctl enable alertmanager

# Verify operation
sudo systemctl status alertmanager
Configure Slack Notifications
For Slack integration, add this receiver to AlertManager configuration:
- name: 'slack-alerts'
  slack_configs:
  - api_url: 'https://hooks.slack.com/services/YOUR/SLACK/WEBHOOK'
    channel: '#network-alerts'
    title: 'MikroTik Alert: {{ .GroupLabels.alertname }}'
    text: |
      {{ range .Alerts }}
      *Alert:* {{ .Annotations.summary }}
      *Description:* {{ .Annotations.description }}
      *Instance:* {{ .Labels.instance }}
      *Severity:* {{ .Labels.severity }}
      {{ end }}
Advanced Monitoring Scenarios
Multi-Site MikroTik Monitoring
Configure monitoring across multiple locations with centralized visibility:
Federated Prometheus Setup
- Central Prometheus server: Aggregates metrics from remote sites
- Site-specific exporters: Deploy SNMP exporters at each location
- VPN connectivity: Secure tunnels for remote monitoring access
- Hierarchical dashboards: Site overview and drill-down capabilities
Federation Configuration
# Add to central Prometheus configuration
scrape_configs:
  - job_name: 'federate'
    scrape_interval: 15s
    honor_labels: true
    metrics_path: '/federate'
    params:
      'match[]':
        - '{job="mikrotik-snmp"}'
        - '{__name__=~"job:.*"}'
    static_configs:
      - targets:
        - 'site1-prometheus:9090'
        - 'site2-prometheus:9090'
        - 'site3-prometheus:9090'
High-Availability Monitoring Setup
Ensure monitoring system resilience and eliminate single points of failure:
Prometheus High Availability
- Identical Prometheus instances: Run multiple servers with same configuration
- External storage: Use remote storage solutions for data persistence
- Load balancer: Distribute queries across Prometheus instances
- AlertManager clustering: Prevent duplicate alert notifications
Grafana High Availability
# Install and configure MySQL/PostgreSQL backend
sudo apt install mysql-server

# Update Grafana configuration for external database
[database]
type = mysql
host = localhost:3306
name = grafana
user = grafana
password = secure_password

# Enable clustering
[remote_cache]
type = redis
connstr = addr=localhost:6379
Custom Metrics and Exporters
Extend monitoring beyond standard SNMP metrics:
Custom Script Exporter
#!/bin/bash
# Custom MikroTik monitoring script
# /opt/monitoring/mikrotik_custom.sh

DEVICE_IP=$1
COMMUNITY=$2

# Check VPN tunnel status
VPN_STATUS=$(snmpget -v2c -c $COMMUNITY -Oqv $DEVICE_IP 1.3.6.1.4.1.14988.1.1.1.2.1.4.1)

# Check DHCP pool utilization
DHCP_USED=$(snmpget -v2c -c $COMMUNITY -Oqv $DEVICE_IP 1.3.6.1.4.1.14988.1.1.6.1.1.6.1)
DHCP_TOTAL=$(snmpget -v2c -c $COMMUNITY -Oqv $DEVICE_IP 1.3.6.1.4.1.14988.1.1.6.1.1.7.1)

# Output Prometheus metrics
echo "mikrotik_vpn_status{device=\"$DEVICE_IP\"} $VPN_STATUS"
echo "mikrotik_dhcp_used{device=\"$DEVICE_IP\"} $DHCP_USED"
echo "mikrotik_dhcp_total{device=\"$DEVICE_IP\"} $DHCP_TOTAL"
Node Exporter Integration
Monitor the monitoring server itself:
# Install Node Exporter
wget https://github.com/prometheus/node_exporter/releases/download/v1.6.1/node_exporter-1.6.1.linux-amd64.tar.gz
tar -xvf node_exporter-1.6.1.linux-amd64.tar.gz
sudo cp node_exporter-1.6.1.linux-amd64/node_exporter /usr/local/bin/

# Create service file
sudo nano /etc/systemd/system/node_exporter.service

[Unit]
Description=Node Exporter
After=network.target

[Service]
User=prometheus
Group=prometheus
Type=simple
Restart=on-failure
ExecStart=/usr/local/bin/node_exporter

[Install]
WantedBy=multi-user.target

# Start service
sudo systemctl daemon-reload
sudo systemctl start node_exporter
sudo systemctl enable node_exporter
API-Based Monitoring Alternative
Use MikroTik API for enhanced monitoring capabilities:
Python API Monitoring Script
#!/usr/bin/env python3
# MikroTik API monitoring script
import librouteros
from prometheus_client import start_http_server, Gauge
import time

# Prometheus metrics
cpu_usage = Gauge('mikrotik_cpu_usage', 'CPU Usage', ['device'])
memory_usage = Gauge('mikrotik_memory_usage', 'Memory Usage', ['device'])
interface_rx = Gauge('mikrotik_interface_rx_bytes', 'Interface RX bytes', ['device', 'interface'])

def collect_metrics():
    try:
        # Connect to MikroTik
        api = librouteros.connect(host='192.168.1.1',
                                username='monitoring',
                                password='monitoring_password')

        # Get system resources
        resources = api('/system/resource/print')
        cpu_usage.labels(device='192.168.1.1').set(resources[0]['cpu-load'])

        # Get interface statistics
        interfaces = api('/interface/print', stats=True)
        for interface in interfaces:
            interface_rx.labels(
                device='192.168.1.1',
                interface=interface['name']
            ).set(interface['rx-byte'])

    except Exception as e:
        print(f"Error collecting metrics: {e}")

if __name__ == '__main__':
    start_http_server(8000)
    while True:
        collect_metrics()
        time.sleep(30)
Troubleshooting Common Issues
SNMP Connectivity Problems
Problem: SNMP timeout errors
- Check network connectivity: Use ping and traceroute to verify path
- Verify SNMP service: Confirm SNMP is enabled on MikroTik device
- Test community string: Use snmpwalk to validate credentials
- Check firewall rules: Ensure UDP port 161 is accessible
Diagnostic Commands:
# Test basic connectivity
ping 192.168.1.1

# Test SNMP connectivity
snmpget -v2c -c monitoring-ro 192.168.1.1 1.3.6.1.2.1.1.1.0

# Check SNMP exporter logs
sudo journalctl -u snmp_exporter -f

# Verify Prometheus targets
curl http://localhost:9090/api/v1/targets
Problem: Incorrect or missing metrics
- Verify OID support: Check if device supports specific MIB objects
- Update SNMP configuration: Ensure correct module configuration
- Check device firmware: Some OIDs require specific RouterOS versions
- Validate MIB files: Ensure proper MIB compilation and loading
Performance and Scaling Issues
Problem: High memory usage on Prometheus server
- Adjust retention period: Reduce data retention from default 15 days
- Optimize scrape intervals: Increase intervals for less critical metrics
- Use recording rules: Pre-calculate common queries
- Implement metric filtering: Drop unnecessary metrics at ingestion
Memory Optimization Configuration:
# Update Prometheus configuration
global:
  scrape_interval: 60s  # Increased from 30s
  evaluation_interval: 60s

# Add retention settings
--storage.tsdb.retention.time=7d
--storage.tsdb.retention.size=10GB
Problem: Slow dashboard loading times
- Optimize Prometheus queries: Use efficient PromQL expressions
- Implement query caching: Enable Grafana query result caching
- Reduce data resolution: Use lower resolution for long time ranges
- Limit concurrent queries: Set appropriate query concurrency limits
Query Optimization Examples:
# Inefficient query
sum(rate(ifHCInOctets[5m])) by (instance)

# Optimized query with recording rule
mikrotik:interface_bandwidth_total

# Recording rule definition
- record: mikrotik:interface_bandwidth_total
  expr: sum(rate(ifHCInOctets[5m])) by (instance)
Dashboard and Visualization Problems
Problem: Missing or incorrect data in panels
- Verify data source connection: Test Prometheus connectivity in Grafana
- Check query syntax: Validate PromQL expressions in Prometheus UI
- Confirm metric existence: Search for metrics in Prometheus graph interface
- Review time ranges: Ensure appropriate time windows for data availability
Problem: Template variable issues
- Check variable queries: Ensure queries return expected values
- Validate variable usage: Confirm proper variable syntax in panels
- Review dependencies: Check variable dependency chains
- Clear browser cache: Resolve cached variable value issues
Alerting and Notification Issues
Problem: Alerts not firing
- Check alert rule syntax: Validate PromQL expressions in alert rules
- Verify evaluation intervals: Ensure rules are evaluated regularly
- Review alert conditions: Confirm thresholds and duration settings
- Check AlertManager connectivity: Test communication between components
Problem: Duplicate or missing notifications
- Review routing rules: Check AlertManager routing configuration
- Verify receiver configuration: Confirm notification channel setup
- Check grouping settings: Ensure appropriate alert grouping
- Review inhibition rules: Verify alert suppression logic
Production Deployment Best Practices
Security Hardening Checklist
Network Security
- Implement network segmentation: Isolate monitoring infrastructure
- Use VPN connections: Secure communication for remote sites
- Configure firewall rules: Restrict access to monitoring ports
- Enable SSL/TLS: Encrypt web interface communications
Authentication and Authorization
- Change default passwords: Use complex, unique passwords for all services
- Implement RBAC: Role-based access control for Grafana users
- Enable audit logging: Track user actions and system changes
- Regular access reviews: Quarterly review of user permissions
SNMP Security Measures
# SNMPv3 configuration for enhanced security
/snmp set enabled=yes
/user add name=snmpv3-user group=read password=ComplexPassword123
/snmp set engine-id=80:00:00:00:01:02:03:04:05
Performance Optimization Guidelines
Resource Allocation
- CPU allocation: 2-4 cores for monitoring up to 100 devices
- Memory requirements: 8GB+ RAM for production environments
- Storage planning: 1GB per device per month for standard metrics
- Network bandwidth: Factor in SNMP polling and dashboard access
Monitoring Configuration Optimization
# Optimized scrape intervals by priority
scrape_configs:
  - job_name: 'critical-devices'
    scrape_interval: 30s
    static_configs:
      - targets: ['core-router-1', 'core-router-2']

  - job_name: 'standard-devices'
    scrape_interval: 60s
    static_configs:
      - targets: ['access-switch-1', 'access-switch-2']

  - job_name: 'edge-devices'
    scrape_interval: 300s
    static_configs:
      - targets: ['remote-ap-1', 'remote-ap-2']
Backup and Recovery Procedures
Automated Backup Script
#!/bin/bash
# /opt/monitoring/backup.sh

BACKUP_DIR="/opt/backups/monitoring"
DATE=$(date +%Y%m%d_%H%M%S)

# Create backup directory
mkdir -p $BACKUP_DIR/$DATE

# Backup Prometheus data
sudo systemctl stop prometheus
tar -czf $BACKUP_DIR/$DATE/prometheus_data.tar.gz /var/lib/prometheus/
sudo systemctl start prometheus

# Backup configurations
tar -czf $BACKUP_DIR/$DATE/configs.tar.gz \
  /etc/prometheus/ \
  /etc/grafana/ \
  /etc/alertmanager/

# Backup Grafana database
sudo -u grafana grafana-cli admin export-dashboard \
  --output-dir $BACKUP_DIR/$DATE/grafana_dashboards/

# Clean old backups (keep last 30 days)
find $BACKUP_DIR -type d -mtime +30 -exec rm -rf {} \;

echo "Backup completed: $BACKUP_DIR/$DATE"
Recovery Testing
- Monthly recovery tests: Validate backup integrity and restore procedures
- Document procedures: Maintain detailed recovery runbooks
- Test different scenarios: Complete failure, partial corruption, configuration loss
- Measure recovery times: Track RTO (Recovery Time Objective) metrics
Maintenance and Operations
Regular Health Checks
#!/bin/bash
# /opt/monitoring/health_check.sh

# Check Prometheus health
if ! curl -s http://localhost:9090/-/healthy > /dev/null; then
    echo "ERROR: Prometheus unhealthy"
fi

# Check Grafana health
if ! curl -s http://localhost:3000/api/health > /dev/null; then
    echo "ERROR: Grafana unhealthy"
fi

# Check SNMP exporter
if ! curl -s http://localhost:9116/metrics > /dev/null; then
    echo "ERROR: SNMP exporter unhealthy"
fi

# Check disk space
DISK_USAGE=$(df /var/lib/prometheus | awk 'NR==2 {print $5}' | sed 's/%//')
if [ $DISK_USAGE -gt 80 ]; then
    echo "WARNING: High disk usage: $DISK_USAGE%"
fi

echo "Health check completed"
Update Procedures
- Test updates in staging: Validate new versions before production deployment
- Schedule maintenance windows: Plan updates during low-traffic periods
- Create rollback plans: Document procedures for reverting changes
- Monitor post-update: Verify functionality after applying updates
Conclusion
Key Benefits Achieved
This comprehensive monitoring setup provides enterprise-grade visibility into your MikroTik infrastructure:
- Proactive monitoring: Identify issues before they impact users
- Historical analysis: Track performance trends and capacity planning
- Automated alerting: Immediate notification of critical issues
- Centralized visibility: Single dashboard for entire network infrastructure
- Cost-effective solution: Open-source tools with enterprise features
Scaling Your Monitoring Infrastructure
As your network grows, this monitoring foundation scales effectively:
- Add new devices: Simple configuration updates to monitor additional MikroTik devices
- Expand metrics: Custom exporters for specialized monitoring requirements
- Integrate systems: Connect with existing network management tools
- Advanced analytics: Machine learning integration for predictive monitoring
Next Steps for Advanced Implementation
- Implement automated remediation: Scripts triggered by specific alert conditions
- Deploy configuration management: Ansible or Terraform for infrastructure as code
- Add performance baselines: Statistical analysis for anomaly detection
- Integrate with ticketing systems: Automatic incident creation for critical alerts
Community Resources
- Prometheus documentation: https://prometheus.io/docs/
- Grafana community dashboards: https://grafana.com/grafana/dashboards/
This monitoring solution transforms network operations from reactive troubleshooting to proactive management. The combination of Prometheus metrics collection, Grafana visualization, and comprehensive alerting provides the foundation for reliable, high-performance network operations.
Regular maintenance, security updates, and continuous improvement ensure your monitoring infrastructure remains effective as your network evolves. The investment in proper monitoring pays dividends through reduced downtime, improved performance, and enhanced user satisfaction.
Check our list of MikroTik guides.