Wireshark DNS Troubleshooting Guide
DNS problems cause more network outages than most engineers admit. A user reports “the internet is down.” You check the gateway. You check the firewall. Everything routes fine. Then you find it: a DNS server that never answers, or answers with the wrong record.
Wireshark shows you the DNS conversation packet by packet. This guide walks through capture setup, display filters, and the DNS problems you will see most often in enterprise networks.
Table of Contents
- Why Use Wireshark for DNS Troubleshooting
- Step 1: Set Up the Capture
- Step 2: Apply DNS Display Filters
- Step 3: Read the DNS Packet Structure
- Common DNS Problems and How to Spot Them
- DNS Response Codes Reference Table
- Advanced Filters for Deeper Analysis
- Use Wireshark Statistics for DNS Performance
- Capture DNS Traffic on MikroTik Routers
- Troubleshooting Checklist
- Conclusion
Why Use Wireshark for DNS Troubleshooting
Tools like dig and nslookup answer one question: does this query resolve right now. Wireshark answers a different question: what actually happened on the wire.
Wireshark shows you:
- The exact query sent, byte for byte
- The exact response received, or the lack of a response
- The time between query and response
- Retransmissions and timeouts
- Which DNS server answered, when multiple servers are configured
This detail matters when dig reports success but users still complain. A capture reveals timing problems and intermittent failures that single lookups miss.
Step 1: Set Up the Capture
Follow these steps before you start troubleshooting:
- Choose the right interface. Capture on the client interface if you suspect the problem is local. Capture on the DNS server interface if you suspect the server. Capture on the WAN interface if you suspect an upstream resolver.
- Apply a capture filter to reduce noise. Use
udp port 53 or tcp port 53to grab both UDP and TCP DNS traffic. TCP port 53 carries zone transfers and large responses that exceed the UDP payload limit. - Start the capture before you reproduce the issue. Late captures miss the first query, which is often the one that fails.
- Reproduce the problem. Run the failing command, load the failing site, or wait for the reported symptom to occur again.
- Stop the capture once you see the DNS exchange, and save it as a
.pcapngfile for reference.
Capture filter examples
udp port 53
tcp port 53 or udp port 53
host 10.0.0.53 and udp port 53
Step 2: Apply DNS Display Filters
A capture filter limits what Wireshark records. A display filter limits what Wireshark shows you from an existing capture. Use display filters to narrow a large capture down to the DNS traffic that matters.
Basic DNS display filters
dns— show every DNS packetdns.flags.response == 0— show only queriesdns.flags.response == 1— show only responsesdns.qry.name == "example.com"— show queries for one exact domaindns.qry.name contains "example"— show queries that include a stringdns.qry.type == 1— show A record queriesdns.qry.type == 28— show AAAA record queriesdns.qry.type == 5— show CNAME record queriesdns.qry.type == 15— show MX record queriesdns.qry.type == 6— show SOA record queries
Filters that find problems directly
dns.flags.rcode != 0— show every DNS error responsedns.flags.rcode == 3— show NXDOMAIN responses (name does not exist)dns.flags.rcode == 2— show SERVFAIL responses (server error)dns.time > 1— show responses that took over one seconddns.retransmission == 1— show retransmitted queriesdns.count.answers == 0 and dns.flags.response == 1— show responses with zero answers
Step 3: Read the DNS Packet Structure
Expand a DNS packet in Wireshark and check these fields in order:
- Transaction ID. Every query gets a unique ID. The matching response carries the same ID. Mismatched IDs point to spoofing or an overlapping capture.
- Flags. Confirm the query/response bit, the opcode, and the reply code (Rcode). A non-zero Rcode always signals an error.
- Questions. Confirm the exact name and record type the client requested.
- Answer RRs. Confirm the count. Zero answers on a response with Rcode 0 (NOERROR) often means an empty result, not a full failure.
- Time. Wireshark calculates the delay between query and response automatically and shows it as
[Time: X seconds]under the response packet, when name resolution is enabled.
Common DNS Problems and How to Spot Them
1. No response from the DNS server
- Symptom in Wireshark: A query packet with no matching response, followed by repeated queries with the same name and increasing intervals.
- Filter:
dns.flags.response == 0, then check for a missing pair. - Likely cause: Firewall block, wrong DNS server IP, or the server process is down.
2. NXDOMAIN errors
- Symptom in Wireshark: Response with Rcode 3.
- Filter:
dns.flags.rcode == 3 - Likely cause: Typo in the domain name, a record that was deleted, or a domain that has not propagated yet.
3. SERVFAIL errors
- Symptom in Wireshark: Response with Rcode 2.
- Filter:
dns.flags.rcode == 2 - Likely cause: DNSSEC validation failure, a broken forwarder chain, or the upstream server is unreachable.
4. Slow DNS responses
- Symptom in Wireshark: Large gap in timestamps between query and response.
- Filter:
dns.time > 1 - Likely cause: An overloaded DNS server, a slow recursive lookup chain, or a network path with high latency to the resolver.
5. Retransmissions
- Symptom in Wireshark: The same query name and type sent multiple times from the same client.
- Filter:
dns.retransmission == 1 - Likely cause: Packet loss between client and server, or a server that drops queries under load.
6. Wrong IP address returned
- Symptom in Wireshark: A response with Rcode 0 and an answer that does not match the expected IP.
- Filter:
dns.qry.name == "example.com" and dns.flags.response == 1, then inspect the Answer RRs. - Likely cause: Stale cache, a hijacked record, split-horizon DNS returning the wrong zone, or an incorrect host file entry on the client.
7. Duplicate Transaction IDs
- Symptom in Wireshark: Two different queries or responses share the same Transaction ID.
- Filter: Sort the Transaction ID column and scan for repeats within a short time window.
- Likely cause: A retransmission storm, or in rare cases a spoofing attempt.
DNS Response Codes Reference Table
| Rcode Value | Name | Meaning |
|---|---|---|
| 0 | NOERROR | Query succeeded |
| 1 | FORMERR | Server could not parse the query |
| 2 | SERVFAIL | Server encountered an internal error |
| 3 | NXDOMAIN | Domain name does not exist |
| 4 | NOTIMP | Server does not support the requested query type |
| 5 | REFUSED | Server refused to answer the query |
| 9 | NOTAUTH | Server is not authoritative for the zone |
Advanced Filters for Deeper Analysis
dns.flags.recdesired == 1— show queries that request recursiondns.flags.authoritative == 1— show authoritative responses onlydns.resp.ttl < 60— show answers with a low TTL, useful for cache-churn issuestcp.port == 53— show DNS over TCP, common for zone transfers and large responsesdns.qry.name contains "internal.corp"— isolate queries for an internal domainip.addr == 10.0.0.53 and dns— isolate all DNS traffic to or from one serverdns.count.queries > 1— show malformed packets carrying more than one question, rare but worth checking on custom appliances
Use Wireshark Statistics for DNS Performance
Wireshark includes a built-in DNS statistics view. Open it from the menu:
- Go to Statistics > DNS.
- Review the breakdown of query types, response rates, and Rcode counts.
- Use this view to confirm a pattern before you commit to a root cause. One slow query might be a fluke. A high percentage of SERVFAIL responses is a server problem.
For command-line analysis with tshark, run:
tshark -r capture.pcapng -z dns,treeThis prints a tree of query types, response codes, and round-trip time buckets, without opening the GUI.
Capture DNS Traffic on MikroTik Routers
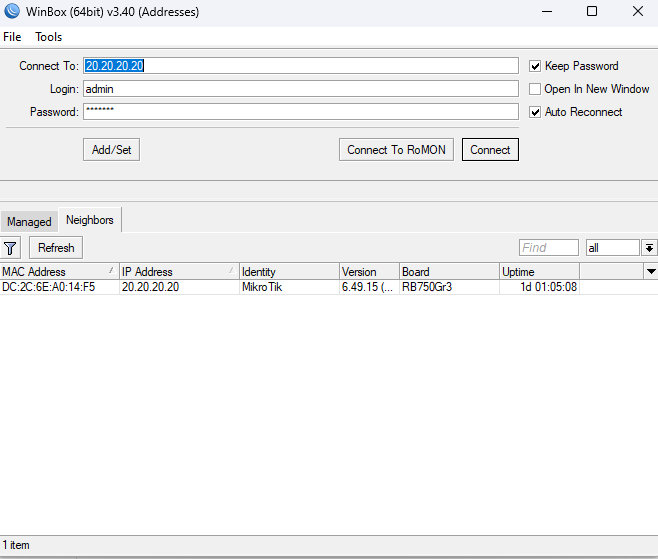
Enterprise networks often route DNS through a MikroTik router, either as a forwarder or a transit device. RouterOS gives you two built-in tools to capture that traffic before you ever open Wireshark on a client.
Option 1: Packet Sniffer with streaming to Wireshark
/tool sniffer set streaming-enabled=yes streaming-server=192.168.1.50
/tool sniffer start
Set streaming-server to the IP address of the machine running Wireshark. Wireshark receives the stream live over UDP, so you watch DNS traffic on the router in real time.
Option 2: Packet Sniffer to a local file
/tool sniffer set file-name=dns-capture filter-port=53 filter-stream=no
/tool sniffer start
... reproduce the issue ...
/tool sniffer stop
/file print
Download the resulting .pcap file from Files and open it directly in Wireshark.
Option 3: Torch for a quick live check
/tool torch interface=ether1 port=53
Torch shows live traffic counters per port and address. Use it to confirm DNS traffic is flowing before you commit to a full packet capture.
MikroTik DNS cache commands worth checking alongside a capture
/ip dns print— confirm the configured upstream servers/ip dns cache print— view cached records on the router/ip dns cache flush— clear the cache when you suspect a stale record/ip dns set allow-remote-requests=yes— confirm this is enabled if the router acts as a resolver for clients
A stale cache entry on the router produces the same symptom as a client-side cache problem: the packet capture shows a correct query and a fast response, but the answer is out of date. Flush the cache and repeat the capture to confirm.
Troubleshooting Checklist
- Capture on the correct segment: client, server, or WAN edge
- Filter with
udp port 53 or tcp port 53at capture time - Check for a response to every query
- Check the Rcode on every response
- Check response time with
dns.time > 1 - Check for retransmissions with
dns.retransmission == 1 - Confirm the returned IP address matches the expected record
- Check TTL values for cache-related symptoms
- Review Statistics > DNS for patterns across the full capture
- On MikroTik routers, cross-check
/ip dns cache printagainst the capture
Conclusion
Wireshark turns DNS from a guessing game into a visible, packet-by-packet record. Filter for the Rcode first. Check timing second. Confirm the returned answer last. This order finds the root cause fast, whether the problem sits on a client, a DNS server, or a MikroTik router in between.
Save your display filters as a Wireshark filter button, so the next DNS ticket takes minutes instead of an hour.