MikroTik Netwatch: Uptime Monitoring and Automated Actions
Why Network Monitoring Matters
Network downtime costs businesses an average of $5,600 per minute, according to recent industry studies. Modern enterprises cannot afford reactive network management approaches. Network administrators need proactive monitoring solutions that detect problems before they impact end users.
MikroTik Netwatch provides a powerful solution for network uptime monitoring and automated responses. This RouterOS feature monitors network hosts continuously and executes custom scripts when host status changes occur. Network engineers can implement automated failover, alerting systems, and recovery procedures using Netwatch capabilities.
This comprehensive guide covers Netwatch fundamentals, advanced automation techniques, and enterprise deployment strategies. You will learn practical configuration examples, performance optimization methods, and troubleshooting procedures for production environments.
Understanding MikroTik Netwatch Fundamentals
What is MikroTik Netwatch?
MikroTik Netwatch is a built-in RouterOS monitoring tool that tracks network host availability. The system sends ICMP pings to specified IP addresses and executes scripts based on host state changes. Netwatch integrates directly with RouterOS system functions, enabling automated network management without external dependencies.
Key advantages of Netwatch include:
- Zero licensing costs compared to external monitoring solutions
- Direct integration with RouterOS routing and firewall functions
- Low resource consumption suitable for edge devices
- Customizable scripting for complex automation scenarios
Netwatch Architecture and Components
Netwatch operates through several core components:
Host Monitoring Engine: This component manages ping operations to configured targets. The engine tracks response times, packet loss, and connectivity status for each monitored host.
Script Execution Framework: When host status changes occur, Netwatch executes user-defined scripts. The framework provides access to RouterOS commands and system variables.
Status Tracking System: Netwatch maintains host status information in memory and provides this data through CLI commands and SNMP interfaces.
Netwatch Probe Types: Choosing the Right Monitoring Method
ICMP Ping Monitoring
ICMP ping monitoring represents the most common Netwatch deployment method. This approach sends Internet Control Message Protocol packets to target hosts and measures response times.
Configuration Example:
/tool netwatch
add host=8.8.8.8 interval=30s timeout=5s up-script=":log info \"DNS server 8.8.8.8 is UP\"" down-script=":log info \"DNS server 8.8.8.8 is DOWN\""
Best use cases for ICMP monitoring include:
- Internet gateway connectivity verification
- Core network infrastructure monitoring
- Remote site connectivity checks
Limitations include firewall blocking and ICMP rate limiting on some networks.
TCP Connection Monitoring
TCP connection monitoring establishes connections to specific ports on target hosts. This method verifies service availability rather than just network connectivity.
Configuration Example:
/tool netwatch
add host=192.168.1.100 type=tcp-conn port=80 interval=60s timeout=10s up-script=":log info \"Web server is responding\"" down-script=":log info \"Web server is down\""
TCP monitoring works effectively for:
- Web server availability checking
- Database server monitoring
- Application service verification
HTTP/HTTPS GET Monitoring
HTTP GET monitoring performs actual web requests to verify web service functionality. This method provides deeper service validation than simple TCP connections.
Configuration Example:
/tool netwatch
add host=www.example.com type=http-get http-codes=200,301,302 interval=300s timeout=15s up-script=":log info \"Website is accessible\"" down-script=":log info \"Website failed to respond\""
HTTP monitoring benefits include:
- Web application health verification
- SSL certificate validation
- Content delivery network monitoring
DNS Query Monitoring
DNS query monitoring sends domain name resolution requests to target DNS servers. This method verifies both network connectivity and DNS service functionality.
Configuration Example:
/tool netwatch
add host=1.1.1.1 type=dns query=example.com interval=120s timeout=8s up-script=":log info \"DNS resolution working\"" down-script=":log info \"DNS resolution failed\""
Basic MikroTik Netwatch Configuration
Initial Setup and Configuration
Netwatch configuration requires proper planning of monitoring targets, intervals, and response actions. Begin with conservative settings to avoid system overload.
CLI Configuration Method:
# Basic host monitoring setup
/tool netwatch
add host=192.168.1.1 interval=30s timeout=5s
add host=8.8.8.8 interval=60s timeout=10s
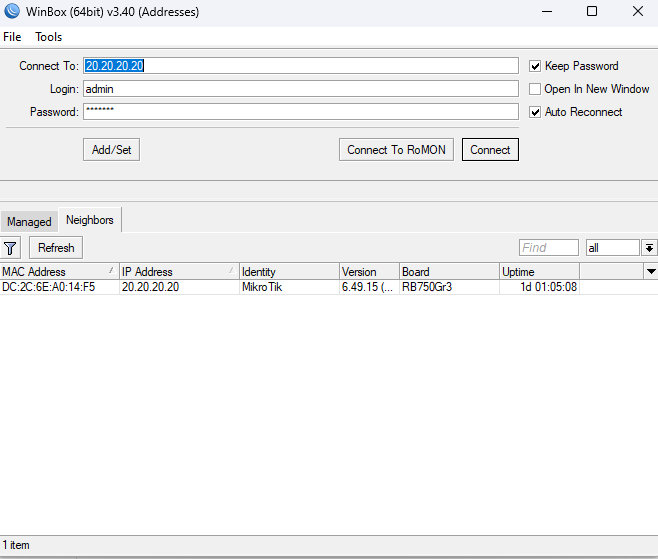
add host=192.168.10.1 interval=45s timeout=7sWinBox Configuration: Navigate to Tools > Netwatch. Click the plus button to add new monitoring entries. Configure host addresses, intervals, and timeout values through the graphical interface.
Essential Parameters Explained
Host: The IP address or hostname of the target device. Use IP addresses for better performance and reliability.
Interval: Time between monitoring attempts. Shorter intervals provide faster detection but increase system load. Typical values range from 10 seconds to 5 minutes.
Timeout: Maximum wait time for responses. Set timeout values to 20-30% of the interval value to prevent overlapping requests.
Up-threshold and Down-threshold: Number of consecutive successful or failed attempts required to change host status. Default values work for most scenarios.
Testing Your Netwatch Configuration
Verify Netwatch operation using these commands:
# Display current netwatch status
/tool netwatch print

# Show detailed host information
/tool netwatch print detail

# Monitor real-time status changes
/tool netwatch print follow
Check system logs for script execution:
# View recent log entries
/log print where topics~"script"

# Filter netwatch-related entries
/log print where message~"netwatch"
Advanced Netwatch Scripting and Automation
RouterOS Scripting Fundamentals for Netwatch
Netwatch scripts execute with the permissions of their owner user account. Script permissions must include necessary policies for intended actions. Common policies include read, write, policy, test, and reboot.
Global variables enable data sharing between scripts:
# Set global variable in up-script
:global WANStatus "UP"
:log info "WAN connection restored"

# Read global variable in down-script
:global WANStatus "DOWN"
:log warning "WAN connection failed"
Automated Network Infrastructure Responses
Interface Management Automation:
# Disable backup interface when primary comes online
/tool netwatch
add host=192.168.1.1 interval=30s up-script={
    /interface disable ether2-backup
    :log info "Primary link UP - backup disabled"
} down-script={
    /interface enable ether2-backup
    :log warning "Primary link DOWN - backup enabled"
}
Dynamic Route Manipulation:
# WAN failover with route switching
/tool netwatch
add host=8.8.8.8 interval=30s up-script={
    /ip route set [find dst-address=0.0.0.0/0 gateway=192.168.2.1] distance=1
    /ip route set [find dst-address=0.0.0.0/0 gateway=192.168.3.1] distance=2
    :log info "Primary WAN restored - routes updated"
} down-script={
    /ip route set [find dst-address=0.0.0.0/0 gateway=192.168.2.1] distance=2
    /ip route set [find dst-address=0.0.0.0/0 gateway=192.168.3.1] distance=1
    :log warning "Primary WAN failed - failover activated"
}
Email Notification Setup
Configure SMTP settings for email alerts:
# Configure email server
/tool e-mail
set server=smtp.gmail.com port=587 start-tls=yes user=your-email@gmail.com password="app-password"
Email Alert Script Example:
/tool netwatch
add host=192.168.1.100 interval=60s down-script={
    :local currentTime [/system clock get time]
    :local currentDate [/system clock get date]
    :local deviceName [/system identity get name]

    /tool e-mail send to="admin@company.com" subject="$deviceName - Server Down Alert" body="Server 192.168.1.100 is not responding as of $currentDate $currentTime. Please investigate immediately."

    :log error "Email alert sent - Server 192.168.1.100 down"
}
SMS Alert Integration
For networks with cellular modems, SMS alerts provide reliable out-of-band notifications:
/tool netwatch
add host=192.168.1.1 interval=45s down-script={
    :local deviceName [/system identity get name]
    :local currentTime [/system clock get time]

    /tool sms send port=usb1 phone-number="+1234567890" message="ALERT: $deviceName - Gateway down at $currentTime"

    :log warning "SMS alert sent - Gateway failure"
}
Enterprise-Grade Netwatch Implementations
ISP and WAN Failover Solutions
Enterprise networks require sophisticated failover mechanisms for business continuity. Multi-WAN monitoring strategies ensure automatic failover with minimal service disruption.
Dual ISP Monitoring Configuration:
# Monitor primary ISP gateway
/tool netwatch
add host=203.0.113.1 interval=15s timeout=5s up-script={
    /ip route set [find comment="primary-wan"] distance=1
    /ip route set [find comment="backup-wan"] distance=10
    :global PrimaryWAN "UP"
    :log info "Primary ISP operational - preferred routing active"
} down-script={
    /ip route set [find comment="primary-wan"] distance=10
    /ip route set [find comment="backup-wan"] distance=1
    :global PrimaryWAN "DOWN"
    :log warning "Primary ISP failed - backup routing activated"
}

# Monitor backup ISP gateway
/tool netwatch
add host=198.51.100.1 interval=20s timeout=7s down-script={
    :global PrimaryWAN
    :if ($PrimaryWAN = "DOWN") do={
        :log critical "Both ISP connections failed - network isolation"
        /tool e-mail send to="noc@company.com" subject="CRITICAL: Dual WAN Failure" body="Both primary and backup ISP connections have failed. Immediate attention required."
    }
}
Data Center Server Monitoring
Data center environments require comprehensive monitoring of critical services and infrastructure components.
Multi-Service Monitoring Example:
# Monitor web server cluster
/tool netwatch
add host=192.168.10.10 type=tcp-conn port=80 interval=30s down-script={
    :log warning "Web server 1 failed - removing from load balancer"
    /ip firewall nat set [find comment="web-server-1"] disabled=yes
    /tool e-mail send to="server-team@company.com" subject="Web Server 1 Failure" body="Server 192.168.10.10 has failed health checks and was removed from load balancing pool."
} up-script={
    :log info "Web server 1 restored - adding to load balancer"
    /ip firewall nat set [find comment="web-server-1"] disabled=no
}

# Monitor database server
/tool netwatch
add host=192.168.10.20 type=tcp-conn port=3306 interval=60s down-script={
    :log critical "Database server failed - initiating emergency procedures"
    # Trigger database failover script
    /system script run database-failover
}
Branch Office Automation
Branch offices benefit from automated VPN failover and connectivity monitoring solutions.
VPN Tunnel Monitoring:
# Monitor headquarters connectivity through VPN
/tool netwatch
add host=10.0.0.1 interval=30s timeout=10s down-script={
    :log warning "HQ connectivity lost - attempting VPN restart"
    /interface l2tp-client set [find name="hq-vpn"] disabled=yes
    :delay 10s
    /interface l2tp-client set [find name="hq-vpn"] disabled=no

    # Enable backup internet route
    /ip route set [find comment="backup-route"] distance=1
} up-script={
    :log info "HQ connectivity restored"
    # Restore primary routing
    /ip route set [find comment="backup-route"] distance=10
}
Netwatch Performance Optimization
Monitoring Interval Best Practices
Proper interval configuration balances detection speed with system resource consumption. Aggressive monitoring intervals can overwhelm lower-end devices and network links.
Recommended Intervals by Use Case:
- Critical infrastructure: 15-30 seconds for immediate detection
- Standard servers: 60-120 seconds for balanced monitoring
- Non-critical hosts: 300-600 seconds to minimize overhead
- Remote locations: 45-90 seconds accounting for latency
Bulk Interval Configuration:
# Set all netwatch entries to 60-second intervals
/tool netwatch set [find] interval=60s

# Configure timeouts proportionally
/tool netwatch set [find] timeout=15s
Advanced Threshold Configuration
Up and down thresholds prevent false positive alerts during temporary network issues.
# Configure conservative thresholds
/tool netwatch
add host=192.168.1.1 interval=30s timeout=10s up-threshold=3 down-threshold=2
This configuration requires three consecutive successful pings to mark a host as up and two consecutive failures to mark it as down.
Resource Management
Monitor system resource consumption when running extensive Netwatch deployments:
# Check system resource usage
/system resource print

# Monitor CPU usage over time
/system resource monitor duration=60s
For high-scale deployments with hundreds of monitored hosts, consider:
- Distributing monitoring across multiple devices
- Using longer intervals for non-critical hosts
- Implementing monitoring hierarchies
Troubleshooting Common Netwatch Issues
Configuration Problems
Script Permission Issues: Scripts fail when user accounts lack necessary policies.
# Check user permissions
/user print detail

# Create netwatch user with appropriate permissions
/user add name=netwatch-user group=full password="secure-password"

# Assign script to specific user
/tool netwatch set [find host=192.168.1.1] user=netwatch-user
Script Execution Failures: Monitor script errors in system logs.
# View script-related log entries
/log print where topics~"script,error"

# Enable debug logging for detailed information
/system logging add topics=script,debug action=memory
Performance Issues
High CPU Usage: Excessive monitoring frequency causes performance problems.
# Identify resource-intensive netwatch entries
/tool netwatch print detail where interval<30s

# Temporarily disable problematic entries
/tool netwatch set [find interval<15s] disabled=yes
Network Congestion Impact: Heavy monitoring traffic affects network performance.
# Monitor interface traffic patterns
/interface monitor-traffic ether1 duration=60s

# Implement traffic shaping for monitoring
/queue tree add name=netwatch-limit parent=global max-limit=1M
Debugging Techniques
Script Testing Methods:
# Test individual scripts manually
/system script add name=test-netwatch-script source={
    :log info "Testing netwatch functionality"
    # Insert your netwatch script code here
}

# Execute test script
/system script run test-netwatch-script

# Check execution results
/log print where message~"Testing netwatch"
Security Considerations for Netwatch
Script Security Best Practices
Netwatch scripts execute with significant system privileges. Implement security controls to prevent unauthorized actions and privilege escalation.
Secure Script Development:
# Validate input parameters
:local targetHost "192.168.1.1"
:if ([:len $targetHost] < 7) do={
    :log error "Invalid host address in netwatch script"
    :error "Script execution terminated - invalid input"
}

# Implement error handling
:do {
    /ip route set [find dst-address=0.0.0.0/0] gateway=$targetHost
} on-error={
    :log error "Route update failed in netwatch script"
}
User Account Security:
# Create dedicated netwatch user with minimal permissions
/user add name=netwatch-monitor group=read password="complex-password"

# Grant specific policies only
/user group add name=netwatch-group policy=read,write,policy,test
Access Control and Permissions
Implement least-privilege principles for Netwatch operations:
# Audit current user permissions
/user print detail where name~"netwatch"

# Review script policies
/tool netwatch print detail where user!=""

# Monitor unauthorized access attempts
/log print where message~"login failure"
Netwatch Best Practices and Recommendations
Design Principles
Monitoring Strategy Development: Develop comprehensive monitoring strategies that align with business requirements and technical constraints.
- Prioritize critical infrastructure: Monitor essential services with shorter intervals
- Implement redundant monitoring: Use multiple monitoring points for critical services
- Plan for scale: Design monitoring hierarchies for large networks
- Document thoroughly: Maintain detailed documentation of monitoring configurations
Scalability Planning:
# Example hierarchical monitoring structure
# Tier 1: Core infrastructure (15s intervals)
/tool netwatch add host=core-router-1 interval=15s
/tool netwatch add host=core-switch-1 interval=15s

# Tier 2: Distribution layer (30s intervals)
/tool netwatch add host=dist-switch-1 interval=30s
/tool netwatch add host=dist-switch-2 interval=30s

# Tier 3: Access layer (60s intervals)
/tool netwatch add host=access-switch-1 interval=60s
Operational Guidelines
Change Management Procedures: Implement structured change processes for Netwatch modifications.
- Test configuration changes in lab environments
- Document all modifications with timestamps and reasons
- Implement rollback procedures for failed changes
- Schedule maintenance windows for major updates
Maintenance Schedules:
# Create maintenance script for regular Netwatch cleanup
/system script add name=netwatch-maintenance source={
    :log info "Starting netwatch maintenance"

    # Clear old log entries
    /log remove [find where time<([:totime [/system clock get time]] - 7d)]

    # Verify all netwatch entries are functional
    :foreach nw in=[/tool netwatch find] do={
        :local host [/tool netwatch get $nw host]
        :log info "Verified netwatch entry for $host"
    }

    :log info "Netwatch maintenance completed"
}
Performance Benchmarks
Resource Allocation Guidelines:
- Small networks (1-50 hosts): Any RouterBoard can handle standard monitoring
- Medium networks (51-200 hosts): Use mid-range devices with sufficient RAM
- Large networks (200+ hosts): Consider distributed monitoring or high-end hardware
Capacity Planning Calculations:
# Estimate monitoring overhead
# Formula: (Number of hosts × Packets per interval) / Interval time
# Example: (100 hosts × 1 packet) / 30s = 3.33 packets per second
Conclusion and Next Steps
MikroTik Netwatch provides enterprise-grade network monitoring capabilities without additional licensing costs. This comprehensive tool enables proactive network management through automated responses, intelligent failover systems, and comprehensive alerting mechanisms.
Key takeaways from this guide:
- Netwatch offers multiple monitoring types suitable for different scenarios
- Advanced scripting enables sophisticated automation workflows
- Proper configuration prevents performance issues and false alerts
- Security considerations are essential for production deployments
- Enterprise implementations require careful planning and testing
Implementation Roadmap:
- Phase 1: Deploy basic ICMP monitoring for critical infrastructure
- Phase 2: Implement automated alerting and logging systems
- Phase 3: Add service-specific monitoring with TCP and HTTP probes
- Phase 4: Deploy advanced automation with failover mechanisms
- Phase 5: Integrate with external monitoring and management systems
Start with conservative monitoring intervals and simple scripts. Gradually expand functionality as you gain experience with Netwatch capabilities. Regular testing and documentation ensure reliable operation in production environments.
Network monitoring represents a critical component of modern infrastructure management. MikroTik Netwatch provides the tools necessary for building resilient, self-healing networks that maintain service availability even during component failures.
Check our list of MikroTik guides.